Identify the problem
The first step was to identify the smallest application we could that would consistently crash Ruby 1.9.2. Ryan created the following script which fit the bill nicely.
Fully understanding this script requires knowledge of QT but you may notice we're creating a bunch of Timers here which are spawning threads. You also might be aware of how drastically different the Ruby 1.9 threads are from Ruby 1.8 so we might be on to something here. Running this script resulted in the following Windows crash: (notice the qtbindings 4.6.3.2 gem)

When I identified Ruby 1.9.2 was causing these crashes I installed every released patch level of Ruby 1.9.2 from rubyinstaller.org hoping that one would work. I even tried installing Ruby trunk but they all caused the same crash behavior.
Building Ruby from Source
The Ruby installed by rubyinstaller is optimized which makes it difficult to use in deep debugging sessions. Therefore you need to build Ruby from source which, thanks to the rubyinstaller DevKit, is pretty easy.
First clone the rubyinstaller github project onto your Windows machine. I used cygwin for this although you can also use MSYS and even get TortoiseGIT. I then followed the FAQ to build a gdb friendly build which disables optimization. This takes a long time but once it completes you can set your Windows path to this newly build Ruby.
Debug using gdb
Now that we've build from source gdb is our friend. I used the cygwin version of gdb (make sure to request it in the setup installer) by simply typing it's path followed by ruby (you can also get gdb from MSYS). When gdb is running you run your ruby application with 'run qtimertest.rb' as shown:

Windows Debugger
At this point Ryan had the Windows debugger installed and was able to run Ruby from that to get a more meaningful stack. I'll leave that as an exercise for the reader. What he found was that in the QT code the following Ruby function was being called: rb_exc_raise(). Since Ruby doesn't return from this call we need to break on it and see what is happening.
Breakpoints in gdb
Running gdb again I set a breakpoint by typing 'break rb_exc_raise'. Notice gdb complains that the function is not defined. This is because on Windows 'ruby' itself is basically a wrapper application that calls the Ruby dll which contains all the Ruby awesomeness.

Now we run the qtimertest.rb file again:
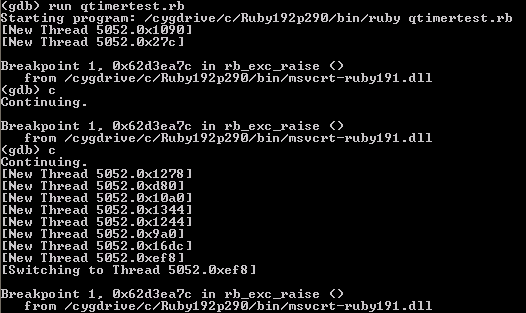
This time we break right away. Compare the number of Threads spawned with the gdb trace from above. If you view the backtrace here you'll notice it does not have anything to do with our bug. So we continue with 'c' and continue again before we spawn all our threads.
Now we break again and view the backtrace:

Ahh, now we have a decent stack trace to look at. The last thing in the stack is a call to stack_check in vm_eval.c:201. So why would a call to stack_check fail within Ruby? If you look at the full trace you'll see that we initially started in the Windows DLL and the proceeded up the stack into Ruby where we called the stack_check method. This causes a crash because you can't call ruby methods from outside of Ruby threads, especially ones checking the thread stack size!
So how did this happen? Well, basically rb_call0 got rewritten from Ruby 1.9.1 to Ruby 1.9.2 and while the call to stack_check was always there, it didn't get called in Ruby < 1.9.2 (at least in our example) but does in the rewritten code causing the crash. Thus the bug was always there but due to the refactoring in Ruby 1.9.2 it presented itself.
Fix the Problem
So what is the solution. We can't change the Ruby code so if we traverse down the stack we find the last call in our QT bindings is QtRuby::Binding::callMethod. So this is where we need to make our fix. Here is the fix Ryan implemented:
Notice the new call to ruby_stack_check. ruby_stack_check in turn calls stack_check. But I thought the call to stack_check was the problem in the first place?! It was but that was a different stack_check! vm_eval.c defines an inline stack_check which calls rb_exc_raise if it returns non zero. gc.c also defines a stack_check which simply returns 0 if the stack is ok or 1 if it has overflowed. So when we call it in our if statement (via ruby_stack_check), it returns 1 and we simply return false rather than trying to do the VirtualMethodCall. Tricky bug with an extremely simple solution.
Hopefully this helps if you have to do the occasional debugging on everyone's favorite platform: Windows.
This blog was inspired by The Passionate Programmer.